
User guide
How to use Informed Portfolio
Enter a portfolio, run any of the 17 analysis tools, read the results, and get the most out of your plan — from a first free backtest to a whole advisory firm.
Screenshots throughout are from a populated demo (Business) account — “Samia Advisory LLC” and its clients are illustrative sample data.
Orientation
How to use this guide
17 of the 19 analysis tools run for free on every plan, with unlimited runs (Growth Replay's video render is limited to 10/day on the Free plan) — including the one you're on right now. The exceptions are Parameter Sensitivity and Contribution Coach, included with every paid plan (Pro, Advisor, and Business). What the paid plans otherwise unlock is everything around the analysis: saving more of your work, keeping it forever, clean reports and share links, more AI Insights, and the professional and team features.
Features that need a particular plan carry a badge: no badge means every plan;Pro+ means Pro, Advisor and Business; Advisor+ means Advisor and Business;Business only means Business only.
You never lose your work
Choosing a plan
Plans at a glance
Four plans. Free is genuinely useful on its own; the paid plans are about keeping your work, presenting it cleanly, and — at the top — running a practice or a team.
| Feature | Free | Pro | Advisor | Business |
|---|---|---|---|---|
| Price | $0 | $15/mo | $45/mo | $150/mo + $30/seat |
| Licensed for | Personal & educational use | Personal use | Commercial use | For advisory firms & teams |
| 16 free analysis tools | Unlimited · Growth Replay 10/day | Unlimited | Unlimited | Unlimited |
| Saved portfolios | 1 | 25 | Unlimited | Unlimited |
| Saved analyses | 3 | 100 | Unlimited | Unlimited |
| History kept | 30 days | Forever | Forever | Forever |
| PDF reports | Watermarked | Clean | Clean, branded | Clean, branded |
| Share links | Branded snapshot | Clean links | Clean, branded | Clean, branded |
| AI Insights | 5 / mo | 50 / mo | 200 / mo | 200 / seat / mo |
| Growth Replay video | 10/day · watermarked | Unlimited · watermarked | Unlimited · clean | Unlimited · clean |
| Portfolio monitors | — | 5 | Unlimited | Unlimited |
| Weekly checkup email | 1 portfolio | 5 portfolios | 5 portfolios | 5 portfolios |
| Branded reports (logo) | — | — | ✓ | ✓ |
| Advisor workspaces | — | — | ✓ | ✓ |
| Team, roles & audit log | — | — | — | ✓ |
| Read-only shared client access | — | — | — | ✓ |
| Priority support | — | — | ✓ | ✓ |
Annual billing saves 20%. Billed once a year that's about $12/mo for Pro ($144/yr), $36/mo for Advisor ($432/yr), and a discounted annual rate for Business. Toggle monthly/annual on the pricing page.
Business is per-seat. The $150 base covers the owner (first seat); each additional analyst is +$30/month (or +$24/month billed annually,$288/year per seat). Adding or removing a seat is prorated as soon as Stripe confirms the change. If Stripe can't be reached the seat showsBilling pending and you can retry from the team manager — we never report a charge or a credit your payment provider hasn't confirmed.
Which plan is for me?
- Just learning or testing ideas for yourself? Free is plenty.
- Managing your own money and want to keep your work with clean reports? Pro.
- Using this professionally with clients? Advisor permits commercial use of attributed derived analyses and reports. Raw market-data redistribution is never included.
- Running a team where analysts share a book of clients? Business.
First steps
Getting started
What Informed Portfolio is
A portfolio research and decision-support platform. You enter a portfolio — a set of stocks, ETFs, or asset classes with weights — and run any of 17 tools that answer questions like “how would this have performed?”, “how risky is it really?”, “will my money last in retirement?”, and “which holdings actually diversify each other?” Every result comes with a plain-English verdict and explanations.
Creating an account & signing in
You can browse and run tools without an account. You need to sign in to save work, email reports, import a screenshot, or use any paid feature. Two ways in:
- Email + password — sign up and set a password. Forgot it? Use the reset link on the sign-in page.
- Continue with Google — one click, using your Google account (your Google email must be verified).
Try Pro free for 7 days
The dashboard
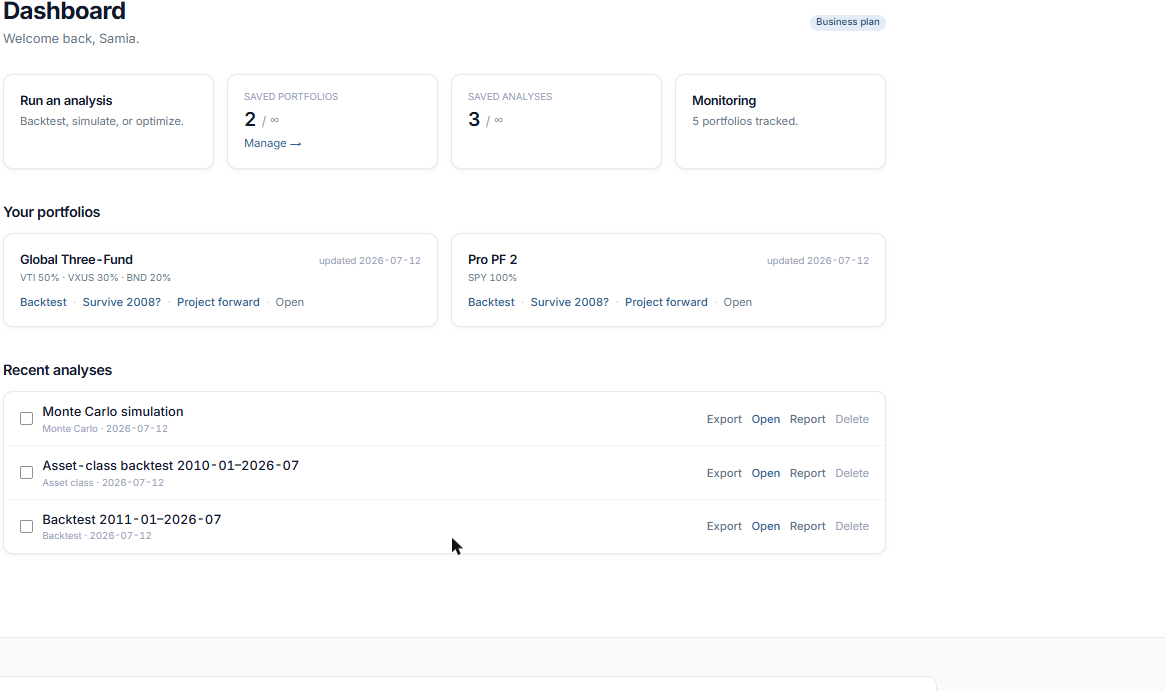
Once signed in, your dashboard is home base: saved portfolios and analyses, your monitors, and quick links into the tools. Saved analyses can be opened, re-run, compared, reported, or shared from here.
The foundation
Entering a portfolio
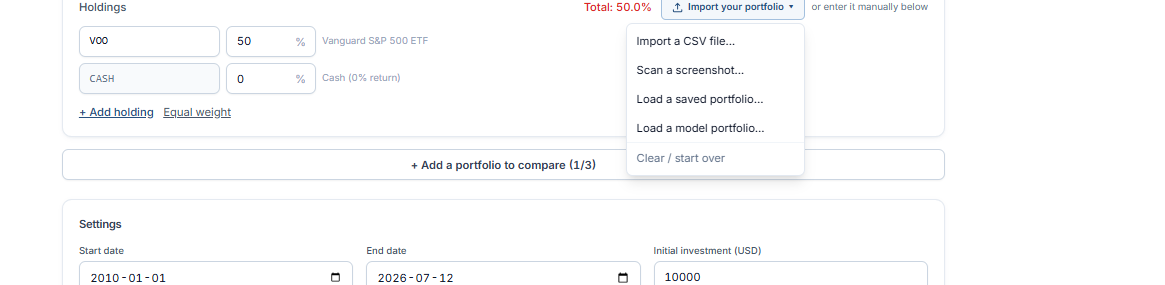
Everything starts with a portfolio. Every tool shows the same holdings editor, so once you learn it you know it everywhere. Type holdings by hand or import them; whatever you enter becomes your active portfolio that follows you tool to tool. At the top of the editor is a prominent “Import your portfolio ▾” button, with “or enter it manually below” underneath.
3.1 Manual entry
- Type a ticker (
VTI,AAPL) into a row — a search suggests matches as you type. - Enter its weight — the percentage of the portfolio in that holding.
- Click “+ Add holding” to add a row, and repeat.
- Weights must total 100%. The editor shows the running total and warns if it's off. The Equal-weight button splits 100% evenly across your rows in one click.
Remove a row with its ✕ control. A few tools (e.g. Correlations) take a plain ticker list with no weights — there the weight column just doesn't appear.
Typo protection
3.2 The CASH row
Add a holding with the ticker CASH to represent uninvested cash or a money-market sleeve. It's a special pseudo-ticker: engines treat it as stable, no-growth, no-dividend, so “60% stocks / 40% cash” behaves as you'd expect. Supported in Backtest, Monte Carlo, Goals, Retirement, Factor, Stress, and Growth Replay; the construction tools that need real return history (Correlations, Efficient Frontier, Optimization, Black-Litterman, Tactical) exclude CASH and will tell you so.
CASH always means your cash sleeve
3.3 CSV import
Choose Import → CSV. The importer reads a simple ticker, weight (or shares/amount) layout right in your browser — your file isn't uploaded to a server. Review the parsed rows and they drop into the editor.
3.4 Screenshot import (OCR)
Got a screenshot of your brokerage holdings? Choose Import → Screenshot and upload the image; Informed Portfolio reads the holdings out of the picture.
- Sign-in required. On Free you get 3 scans per day; on any paid plan scans are unlimited.
- It repairs misread tickers. If a symbol is mis-transcribed but the company name is recognized, it looks up the correct current ticker — e.g. it fixes “Broadcom” to
AVGO(not the retired BRCM), noting “used the closest listing.” - It flags what it can't verify. Any symbol it couldn't confirm against real data is highlighted with a rose ring and marked “couldn't verify.” Fix or delete those rows — the highlight clears as you edit.
Always give the reviewed list a once-over before running. OCR is a big time-saver, not a guarantee.
3.5 Models & examples
The Models menu loads classic ready-made allocations (three-fund, 60/40, all-weather-style mixes) straight into the editor. The Examples gallery does the same for curated scenarios, many deep-linking into a specific tool pre-loaded and ready to run.
3.6 Your active portfolio follows you
The portfolio you're working on is remembered in your browser as your active portfolio. Move from Backtest to Stress Test to Correlations and your holdings come with you — no re-typing. Ticker-list-only tools read it without overwriting, so bouncing through them never degrades what you built. Loading a model, example, or saved portfolio replaces the active one; clearing the editor starts fresh.
Reading results
Reading any result
Every tool presents results the same way, so these conventions apply everywhere:
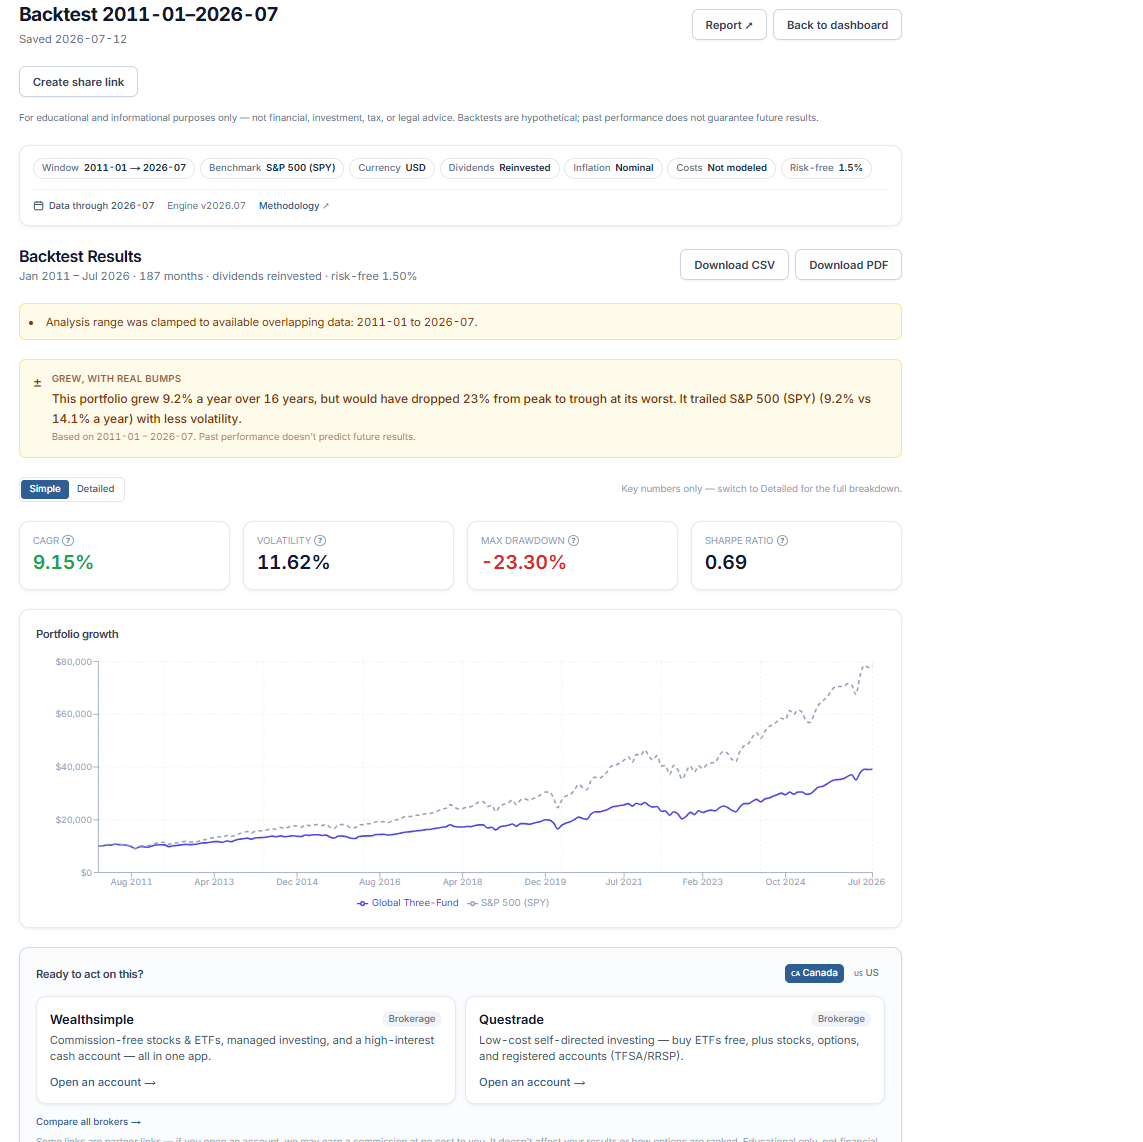
- The verdict banner — a plain-English one-liner summarizing what the numbers say. It's descriptive, never prescriptive.
- Key-metrics cards — the handful of numbers that matter most, up front.
- Tooltips — hover or tap the ⓘ by any metric for a plain-English definition.
- Simple ↔ Detailed toggle — switch between a clean beginner view and the full set of charts and tables. The app remembers your choice.
- “What was analyzed” header — chips for the exact portfolio, dates, and options, plus a Data-through date and engine version, so a result is reproducible.
- Assumptions & limitations panel — what the tool assumes and deliberately ignores (e.g. gross of taxes and trading costs).
- Next steps — suggested follow-on tools for the question you're now asking.
From any result you can Save, Email it to yourself, download CSV / assumptions, or open a printable Report. Public Share links are available for backtest and asset-class results (other types can still be exported or grouped into a project) — all covered below.
Reference
The 19 analysis tools
17 run free and unlimited on every plan; Parameter Sensitivity and Contribution Coach (marked Paid below) are included with every paid plan (Pro, Advisor, and Business). They're grouped below by the question you're answering. Each entry explains what the tool is, gives a step-by-step of how to use it, and lists what you get back — then links straight to the tool and its full “how it works” write-up (both open in a new tab, so you keep your place here).
Understand past performance
Test one or more portfolios of ETFs or stocks against decades of real market data, with the full suite of return and risk metrics.
How to use it
- Enter your portfolio: add each ticker (e.g. VTI, BND) and the percentage you'd hold in it — the weights should add up to 100%.
- Set your assumptions: pick a start and end date, a benchmark to compare against, and how often to rebalance. Optionally add contributions, fees, or inflation.
- Click Run Analysis to see how $10,000 would have grown, alongside CAGR, volatility, Sharpe, and max drawdown. Add up to three portfolios to compare them side by side.
What you get
- Growth of $10,000 (nominal and real)
- CAGR, volatility, Sharpe, Sortino, Calmar
- Max drawdown and drawdown periods
- Beta, alpha, R², tracking error vs. benchmark
- Annual returns, rolling metrics, correlations
- CSV and PDF export
Allocate across US and international stocks, bonds, gold, REITs, commodities, and more — each represented by a widely held ETF.
How to use it
- Set your asset-class mix: choose how much to hold in US stocks, international stocks, bonds, gold, REITs and more — each is mapped to a representative ETF, and the weights should total 100%.
- Pick your settings: a start and end date, a benchmark, how often to rebalance, and your dividend and inflation options.
- Run it to see growth, drawdowns, and full risk metrics, plus how each asset class contributed — all directly comparable to the ticker-level backtester.
What you get
- Full performance and risk metrics
- Growth and drawdown charts
- Asset-class contribution and correlations
- CSV / PDF export
Pick a stock, ETF, or portfolio, add an optional recurring contribution, and watch an animated time-lapse of your money growing — with dividends and price growth as separate lines.
How to use it
- Pick a stock or ETF (e.g. VOO, AAPL) — or add several tickers to replay a whole portfolio.
- Set a start and end date, an initial investment, and an optional recurring contribution.
- Press Run, then play the animation — adjust the speed or scrub the timeline, and watch dividends and price growth race each other.
What you get
- An animated time-lapse of your equity curve
- Three separate lines: contributions, price growth, and dividends
- Live running totals as the animation plays
- Playback speed control (0.25× to 2×) and timeline scrubbing
- Final contributions, growth, dividends, and total value
- Downloadable video (Pro & Advisor)
Sweep one input — fees, rebalance cost, rebalance frequency, or start year — across a range and watch how a chosen metric (CAGR, Sharpe, drawdown, final balance) responds. A single number hides how fragile it is; this shows you.
How to use it
- Enter your portfolio and base settings, just like a backtest.
- Pick one thing to vary — say the annual fee — and the metric you care about, like CAGR.
- Run it to see how far your metric moves across the range, and whether the answer is robust or fragile.
What you get
- A verdict on how sensitive the result is to that assumption
- A one-way chart of the metric across the swept range
- A table of CAGR, drawdown, Sharpe and final balance at every point, with your current setting flagged
- The best and worst outcomes in the range
Measure risk
See exactly how much your portfolio would have dropped in real historical crises, then test 'what-if' shocks — a market crash and a jump in interest rates — using each holding's measured sensitivity.
How to use it
- Enter your portfolio's tickers and weights.
- Set a hypothetical equity shock (e.g. stocks −30%) and an interest-rate shock (e.g. +2%), and the history window used to measure each holding's sensitivity.
- Run it to replay real crises (2008, 2020, 2022) on your portfolio and estimate the immediate hit from your what-if shock — broken down by how much comes from stocks vs. rates.
What you get
- Your portfolio's return and worst drop in each historical crisis vs. the S&P 500 (SPY proxy)
- Estimated portfolio impact from the combined equity + rate shock
- How much of the hit comes from stocks vs. rates
- Each holding's equity beta and rate beta, and its contribution to the loss
- A plain-English interpretation of where your risk is concentrated
See how much of a portfolio's returns come from common style factors versus genuine skill (alpha) — explained in plain English.
How to use it
- Enter a portfolio or fund (tickers and weights) you want to X-ray.
- Choose which style factors to include (market, size, value, momentum, quality) and a date range.
- Run it to see the portfolio's factor exposures, how much of its return is genuine alpha, how much of its movement the factors explain (R²), and a plain-English read on its style.
What you get
- Factor loadings (exposures) with t-statistics
- Annualized alpha and whether it's significant
- R² — how much of returns the factors explain
- Each factor's contribution to return
- A plain-English interpretation of the portfolio's style
A financial-institution-style questionnaire that scores your risk capacity and risk willingness separately, then translates the result into concrete portfolio guardrails and example portfolios.
How to use it
- Answer the ten questions honestly — especially the one about how you'd react to a 20% loss. There are no wrong answers, only wrong portfolios.
- Read your profile: your band, your capacity and willingness scores, and which of the two sets the limit.
- Use the guardrails to judge any portfolio you're considering, and backtest or stress test the example portfolios in one click.
What you get
- Your risk band (Conservative → Aggressive) with a 0–100 score
- Separate risk-capacity and risk-willingness scores, and which one limits you
- Concrete guardrails: max drawdown to prepare for, volatility range, stock allocation range
- Example portfolios inside your stock range, each measured against every guardrail, with live historical CAGR, volatility, Sharpe, and max drawdown
- One-click links to backtest or stress test each suggestion
Test diversification
Build a correlation matrix, a diversification score, and spot redundant or diversifying holdings.
How to use it
- Enter two or more tickers you want to compare (e.g. VTI, BND, GLD, VNQ).
- Choose a date range, a return frequency (daily, weekly, or monthly), and a rolling window.
- Run it to get a correlation heatmap, a single diversification score, the most- and least-correlated pairs, and warnings about holdings that move almost identically.
What you get
- Correlation matrix heatmap
- Diversification score
- Most/least correlated pairs
- Redundancy warnings
- Rolling correlation for any pair
Correlations aren't constant — track how each pair's relationship has evolved, plus the basket's average correlation.
How to use it
- Enter the tickers whose relationship you want to track over time.
- Pick a date range, a return frequency, and the length of the rolling window.
- Run it to watch each pair's correlation move through different market regimes, with an average-pairwise line showing how much real diversification your basket provides at any moment.
What you get
- Rolling correlation per pair
- Average-pairwise-correlation trend
- Latest / average / min / max per pair
Build an allocation
Solve for the minimum-volatility, maximum-Sharpe, risk-parity, or target return/risk portfolio — then see where the risk really sits.
How to use it
- Enter your assets and pick an objective: minimum volatility, maximum Sharpe, risk parity, or a target return/risk.
- Set any per-asset weight limits, the expected-return method, and a risk-free rate.
- Run it to get the optimal weights, see where the risk actually sits (each holding's risk contribution), and compare against equal-weight and a benchmark.
What you get
- Optimal weights
- Weight vs. risk-contribution chart
- Position on the efficient frontier
- Comparison vs. equal-weight & benchmark
- Correlation matrix
Plot the curve of optimal portfolios and locate the minimum-volatility and maximum-Sharpe mixes.
How to use it
- Enter the assets you want to optimize across (e.g. VTI, VEA, VWO, BND, GLD).
- Choose a date range, how expected returns are estimated, any per-asset weight limits, and a risk-free rate.
- Run it to plot the efficient frontier alongside your assets, with the minimum-volatility and maximum-Sharpe portfolios marked — and the frontier data available to download.
What you get
- Efficient frontier curve
- Min-volatility & max-Sharpe portfolios
- Asset and random-portfolio scatter
- Frontier table + CSV
A smarter optimizer: start from the market's implied returns and gently tilt toward your own views with a confidence level — avoiding the extreme portfolios plain optimization produces.
How to use it
- Start from a baseline (neutral) allocation — the market-implied anchor the model builds on.
- Optionally add your own views (e.g. 'I expect emerging markets to return 9%') with a confidence level for each, plus any weight limits.
- Run it to see the market-implied vs. your blended expected returns, the optimized weights vs. your baseline, and a plain-English explanation of what changed and why.
What you get
- Market-implied vs. your blended expected returns
- The optimized weights vs. your baseline
- Expected return, volatility, and Sharpe under your views
- A plain-English explanation of what changed and why
Explore future uncertainty
Estimate the range of outcomes your portfolio might experience using thousands of randomized return paths, with a probability of success.
How to use it
- Set your starting point: an initial balance, a time horizon, and either a historical portfolio or your own expected return and volatility.
- Add any cash flows (monthly or annual contributions or withdrawals), choose the number of simulations and the method (normal or bootstrap), and define what 'success' means.
- Run the simulation to see your probability of success, a percentile cone of outcomes, and the full range of ending balances across thousands of paths.
What you get
- Probability of success
- Median and percentile ending balances
- Year-by-year percentile cone
- Depletion probability
- Ending-balance distribution
Plan a financial goal
Estimate your probability of reaching a target by a date — plus the contribution and return it would take.
How to use it
- Enter your current savings, the amount you're aiming for, and the date you want to reach it by.
- Add your monthly contribution and either pick a historical portfolio or set your own return assumptions, plus inflation.
- Run it to see your probability of reaching the goal — and the monthly contribution or the return it would take to get there.
What you get
- Probability of reaching the goal
- Required monthly contribution
- Required return
- Projection cone vs. goal line
- Best/median/worst scenarios
Enter an amount and see how it would be split across your holdings — filling the underweight ones back toward their target bands first, then spreading the remainder across your plan. It never suggests selling anything.
How to use it
- Set a Plan on a saved portfolio: target weights, a tolerance band, and what the portfolio is worth today.
- Enter the amount you're about to add.
- Read the split — the underweight holdings come first, and the table shows each holding's share before and after.
What you get
- How much of the contribution goes to each holding
- Each holding's share of the portfolio before and after
- How much closed a band gap vs. how much spread across your targets
- Which holdings a contribution alone can't bring back inside the band
Evaluate retirement
Estimate the chance your nest egg lasts through retirement, compare spending strategies, estimate a sustainable starting withdrawal under your assumptions, and see sequence-of-returns risk in action.
How to use it
- Enter your starting savings and how many years your retirement should last.
- Choose a withdrawal strategy and rate (e.g. the 4% rule), a historical portfolio or your own return/volatility, and an inflation assumption.
- Run it to see the probability your money lasts, your income each year in today's dollars, and how an early market crash (sequence risk) would change the outcome.
What you get
- Probability your money lasts
- Your estimated sustainable starting withdrawal (optional finder)
- Income each year in today's dollars (typical and tough cases)
- Balance over time (percentile cone)
- A sequence-of-returns-risk breakdown
Test tactical strategies
Test moving-average timing, relative and dual momentum, and volatility targeting against buy & hold — with a full allocation timeline.
How to use it
- Define your risky universe of tickers and a safe 'out-of-market' asset (such as cash or short-term Treasuries).
- Pick a strategy — moving-average timing, relative or dual momentum, or volatility targeting — set its parameters and a date range, and add an initial (and optional recurring) investment.
- Run it to compare the strategy against buy & hold, with an allocation timeline showing exactly what it held and when, plus trade-count and time-in-market stats.
What you get
- Strategy vs. buy & hold metrics (CAGR, volatility, max drawdown, Sharpe)
- Beta and alpha of the strategy vs. buy & hold
- Growth and drawdown charts
- Allocation timeline (what was held each month)
- Trade count, turnover, and time-in-market stats
Research a security
Look up a company's growth, profitability, financial health, valuation, and dividend record, each translated into language any investor can understand.
How to use it
- Enter a company ticker (e.g. AAPL, MSFT, KO, JNJ) — this tool covers individual companies, not funds or ETFs.
- Submit to pull the company's reported financial statements, ratios, and dividend history.
- Read the results to see whether the business is growing, profitable, financially healthy, and cheap or expensive — every figure explained in plain English.
What you get
- Revenue and earnings growth over the last decade
- Profit margins, return on equity, and other profitability measures
- Valuation ratios — P/E, P/S, P/B, earnings yield
- Financial-health checks — current ratio, debt-to-equity
- Dividend yield, payout ratio, growth streak and history
- A plain-English summary of whether the stock looks cheap, profitable, and healthy
The weighted expense ratio of your holdings, the dollars a year that represents, which holdings account for it, and the compounded difference against a ratio you choose — every figure carrying its source and date.
How to use it
- Enter your holdings and their weights.
- Add each fund's expense ratio from the fund's own page — it's usually on the overview, quoted as a percent like 0.03%.
- Read the weighted cost and, if you want, set an alternative ratio to see the compounded difference at a fixed gross return.
What you get
- Weighted expense ratio, with coverage stated
- Cost per $10,000 a year, and on your own value if you give one
- Which holdings account for the cost, largest first
- 10- and 20-year comparison against a ratio you choose, at an identical gross return
- The source and as-of date behind every ratio used
Want the full method behind any number? See Methodology or open any tool and read its “How it works” section.
Keeping your work
Saving your work
There are two things you can save: a saved analysis (a specific result — the inputs plus the numbers, frozen in time) and a saved portfolio (just the holdings, to reuse across tools). Both live on your dashboard and require a (free) account.
Save an analysis
- Run any tool. Below the result you'll see a Save this analysis bar.
- Give it a name (or accept the suggested one) and click Save. If you're not signed in, a quick sign-up appears first and your result is saved the moment you finish — you won't lose it.
- Find it later under Recent analyses on your dashboard, where each row has Open, Report, Export, and Delete.
Save a portfolio
- In the holdings editor (on any tool), enter or import your holdings.
- Click Save portfolio, name it, and confirm. It now appears under Your portfolios on the dashboard and in the “Load a saved portfolio” import menu everywhere.
Re-run or compare a saved analysis
- Open a saved analysis and click “Re-run with saved inputs” — it reloads the portfolio and re-runs the tool against the latest market data.
- To compare two saved analyses, tick the checkbox on two rows on the dashboard, then choose Compare.
How much you can keep depends on your plan:
| Plan | Saved portfolios | Saved analyses | History kept |
|---|---|---|---|
| Free | 1 | 3 | 30 days |
| Pro | 25 | 100 | Forever |
| Advisor | Unlimited | Unlimited | Forever |
| Business | Unlimited | Unlimited | Forever |
The 30-day free-history window
Output
Reports
A Report is a clean, formatted, printable page of a result — the verdict, key metrics, charts, and the required disclosures — meant to be saved as a PDF or printed for a client or your own records.
Create a PDF report
- Open the analysis you want (from a live result, save it first; or open a saved analysis from the dashboard).
- Click Report ↗ (on the result header, or the Report link on the dashboard row). The report opens on its own page.
- Use your browser's print command (Ctrl/Cmd + P, or the Print / Save as PDF button) and choose “Save as PDF” as the destination. The page is print-styled, so the PDF comes out clean.
Email a report to yourself
- On any result, click “Email me this report”.
- Enter an email address and send — a summary lands in the inbox (the recipient doesn't need an account).
Download the raw numbers
- On a result (or a saved-analysis row), click Export / Download CSV for the data, and the assumptions JSON for the exact inputs — handy for your own spreadsheets and for reproducibility.
What the report looks like depends on your plan:
- Free: reports and PDFs carry an Informed Portfolio watermark.
- Clean, watermark-free reports Pro+
- Reports are also branded with your firm name and logo — set it once under Account → Report branding Advisor+
Interpretation
AI Insights
AI Insights gives a written, plain-English interpretation of your specific numbers — what stands out, the trade-offs, and what to look at next. It reads the actual result, not a generic template.
Get an insight
- Run any tool and scroll to the ✨ AI Insights card below the result.
- Click one of the question chips (e.g. “What stands out?”, “What are the risks?”). The answer is generated from your result in a few seconds.
- Ask more questions with the other chips — each generated answer counts once against your monthly allowance (a failed request doesn't count).
Your monthly allowance and the depth of the analysis scale with your plan:
| Plan | Depth | Insights / month |
|---|---|---|
| Free | Standard | 5 / mo |
| Pro | Detailed | 50 / mo |
| Advisor | In-depth | 200 / mo |
| Business | In-depth | 200 / seat / mo |
Caps reset on a rolling 30-day basis; a failed request doesn't count against you. Higher tiers get both a higher cap and a deeper style of analysis.
Visualization
Growth Replay
Growth Replay animates your money growing over real market history, with contributions, price growth, and dividends as three racing lines. Anyone can create and watch replays in the browser; paid plans can download the animation as a video.
Make a replay
- Open Growth Replay. Pick a stock or ETF (e.g. VOO), or add several tickers for a whole portfolio.
- Set a start and end date, an initial investment, and — optionally — a recurring monthly contribution and dividend reinvestment (DRIP).
- Click Run, then Play. Change the speed (0.25×–2×) or drag the scrubber to move through time; watch contributions, price growth, and dividends separate.
- Download the video: click the export/download control to save the animation as a shareable video (watermark rules below).
| Plan | Runs | Video download |
|---|---|---|
| Free | 10 / day | Watermarked |
| Pro | Unlimited | Watermarked |
| Advisor | Unlimited | Watermark-free |
| Business | Unlimited | Watermark-free |
Note the split
Staying informed
Monitors Pro+
A monitor watches a saved portfolio and alerts you when something moves past a threshold you set, so you don't have to re-run analyses by hand. You need at least one saved portfolio first (see §6).
Set up a monitor
- Go to Monitors (also linked from your dashboard).
- Under “Monitor a saved portfolio,” pick a portfolio from the dropdown and click Start monitoring.
- On the monitor's card, set your alert thresholds — how far it can drift, how big a daily move to flag, and how stale the data can get — then Save alert thresholds.
- Click Check now any time to run it on demand; alerts collect on the page (and Mark all read clears them). Use Remove to stop monitoring.
- Free: monitors aren't available.
- Pro: monitor up to 5 portfolios.
- Advisor / Business: unlimited monitors.
Separately, every plan gets a weekly portfolio checkup email — covering 1 portfolio on Free, up to 5 on paid plans. Turn it on under Account → Emails.
Professional
For advisors Advisor+
Advisor and Business are licensed for commercial (client) use and add the tools a professional needs.
- Commercial use. Use attributed derived analyses, CSVs, emails, reports, and share pages with clients and for business. Raw or cached provider observations and data-feed redistribution are never included.
- Branded reports. Set your firm name and logo once. Both appear on your PDF reports; clean share pages currently carry the firm name only — the uploaded logo is deliberately not rendered on public share pages yet.
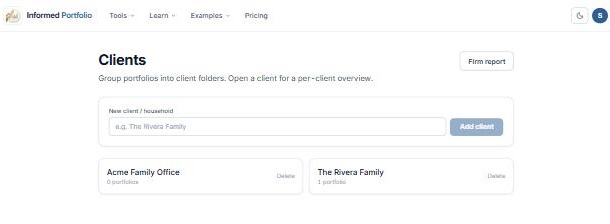
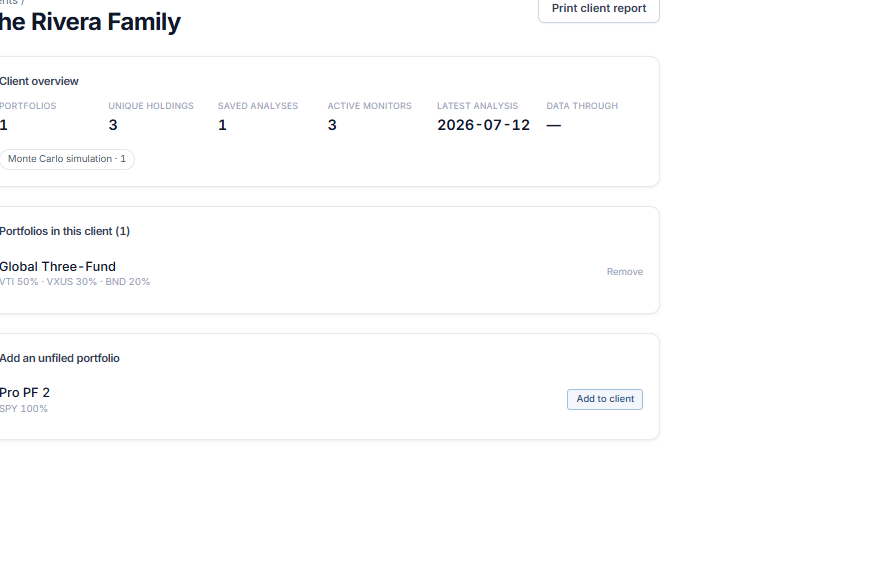
- Advisor workspaces (client folders). Organize portfolios and analyses by client, with a per-client overview and a printable per-client report bundle.
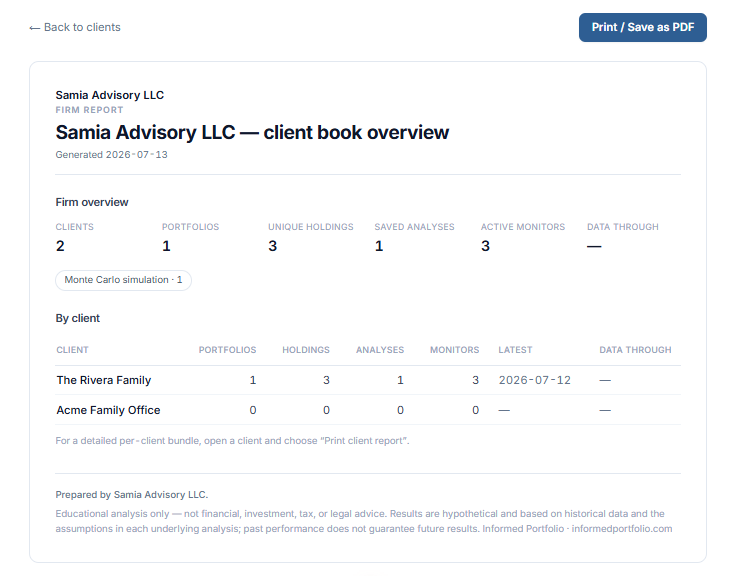
- Firm-wide report Business only — a consolidated printable rollup across all client folders.
Add your firm branding
- Go to Account → Report branding.
- Enter your firm / advisor name and upload a logo, then Save branding. Your name and logo head your PDF reports; clean share pages carry the firm name only. (The required disclosures always remain.)
Organize work by client
- Open Clients and type a client / household name under “New client,” then Add client to create a folder.
- Open the client and use “Add to client” to file one of your saved portfolios into it. The client's overview then rolls up its portfolios, holdings, analyses, monitors, and latest activity.
- Click “Print client report” for a per-client bundle (branding + rollup + each portfolio's latest headline metrics), then Save as PDF.
Report presentation always follows the owner's plan, so client-facing output stays branded and watermark-free as long as the owning account is Advisor or Business.
Teams
Teams & shared access Business only
Business turns a solo workspace into a firm.
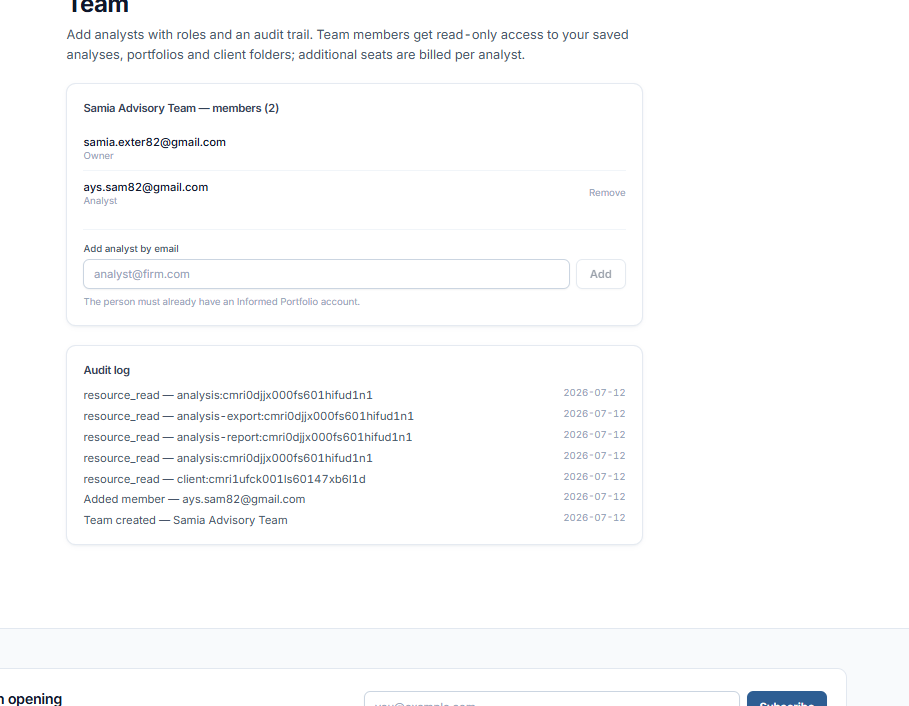
- Add your team. Invite analysts as members with roles. The audit log records team creation, members added and members removed, plus shared-resource reads — an individual saved analysis, its report or export, a portfolio, or a client folder or client report. Each entry names who did it and when. It is append-only and shows the most recent 25 entries; it is not a complete access trail of every list or page view.
- Per-seat billing. The $150 base includes the owner; each additional analyst is +$30/month (or +$24/month billed annually, i.e. $288/year per seat), prorated once Stripe confirms it — an unconfirmed change stays visible as Billing pending with a retry. (Admin-comped Business accounts bill no seats.)
- Read-only shared client access. Team members can view the owner's client book — analyses, portfolios, and folders — read-only, surfaced in a “Shared with you” section.
How sharing works
Add an analyst to your team
- Open Team. Under “Add analyst by email,” enter their address and click Add (they must already have an Informed Portfolio account — free is fine).
- They appear in the roster with the Analyst role. Once the seat's billing is confirmed, they get read-only access to your saved analyses, portfolios, and client folders (under a “Shared with you” section on their side); until then the seat shows Billing pending and both team AI and shared access stay on hold. Membership changes and reads of an individual shared analysis or client record are written to the audit log below — it is not a record of every access (see the note above).
- Adding a seat bills +$30/month (or +$24/month billed annually), prorated once Stripe confirms it; Remove reverses it with a credit on the same terms. Either change can end in Billing pending if Stripe can't be reached — that state is saved, so it survives a refresh and stays retryable. The team manager shows the seats and cost your payment provider reports, and says so plainly when it couldn't confirm them.
Generate the firm-wide report
- From Clients, click Firm report.
- Review the branded rollup (firm totals + a per-client table) and Print / Save as PDF.
Account
Billing & your account
Everything to do with your subscription lives on the Account & Billing page.
Upgrade or change plan
- Open Account (or the pricing page) and toggle Monthly / Annual (annual saves 20%).
- Click Switch to… on the plan you want and complete the Stripe checkout. You come back to a verified confirmation: normally the new plan is already active, but if your payment provider has confirmed the payment while the account update is still landing, the page says “activation is finishing” and a reload usually shows the new limits. We never claim an upgrade we haven't verified — so if your payment method settles slowly (some bank debits take days), the page will say the payment isn't confirmed yet and the plan activates when it is, not before. If a slow payment ultimately fails, the plan is not granted.
Start the free Pro trial
- New accounts can start a 7-day Pro trial — no card, once per account. It unlocks everything in Pro; at the end you drop to Free automatically unless you subscribe (nothing is charged).
Cancel or downgrade
- On Account, use Manage billing & invoices to cancel or switch to a lower plan.
- Cancelling uses cancel-at-period-end — you keep paid access until the end of the period you've already paid for, then drop down. A failed payment during a retry does not immediately downgrade you.
Also on the account page: manage your email/password, the weekly checkup toggle, (Advisor+) your report branding, and (Business) your team & seats — adding or removing an analyst is prorated once Stripe confirms the change, and shows asBilling pending until it does.
Your security
Help
Troubleshooting & FAQ
“We couldn’t find market data for X.”
The ticker X isn’t one we have data for — almost always a typo or a delisted/renamed symbol. The message names the exact ticker so you can spot it. Fix the symbol or try the security’s current ticker. (For OCR imports, this is what the rose-highlighted “couldn’t verify” rows mean.)
My screenshot import got a ticker wrong.
OCR occasionally misreads. The importer auto-repairs symbols it can match to a company name (Broadcom → AVGO) and flags the rest with a rose ring marked “couldn’t verify.” Review flagged rows, edit or delete them — the highlight clears as you type. Sanity-check the list before running.
My weights don’t total 100%.
The editor requires weights to sum to 100%. Use the running total it displays, or click Equal-weight to split evenly, then adjust.
Why can’t I run 2008 in the Stress Test for some portfolios?
A crisis can only be replayed if every holding existed and has price data for that window. Newer funds show 2020 and 2022 but may be unavailable for 2008 — swap in older broad ETFs (SPY, AGG, VTI) to reach further back.
Can I look up an ETF or mutual fund in Stock Fundamentals?
No — funds don’t file company financial statements. Use Backtest, Factor Analysis, or Correlations for funds and ETFs.
Are my inputs sent to your servers?
The Risk Profile questionnaire is scored entirely in your browser — answers are never sent to us. CSV imports are also parsed in-browser. Saved analyses (when you choose to save) are stored to your account.
Is any of this financial advice?
No. Informed Portfolio is educational. Verdicts are descriptive (what the data shows), never prescriptive, and example portfolios are teaching tools, not recommendations. Consult a licensed advisor for personal advice.
Do results include taxes and trading costs?
By default results are gross of taxes, spreads, and commissions (Backtest can model advisory fees; Tactical reports turnover). Each tool’s Assumptions & limitations panel spells out exactly what’s included.
Is there a data-export API?
Not currently. A machine-readable data/export API is not available on any plan right now, due to our market-data provider’s licensing terms. The app’s own exports — CSV, assumptions JSON, PDF/print reports — are available as described above.
My saved analysis disappeared (Free plan).
Free keeps saved analyses for 30 days. You get an in-app countdown and an email at least 7 days before expiry; export the CSV to keep the numbers, or upgrade to Pro to keep everything forever.
Where does the market data come from?
Equities and fundamentals from Twelve Data; macro/rate series from FRED. Attribution and the data-through date appear in the footer, on /methodology, and on each result.
Still stuck? Contact support (Advisor & Business get priority support), check system status, or read the methodology.